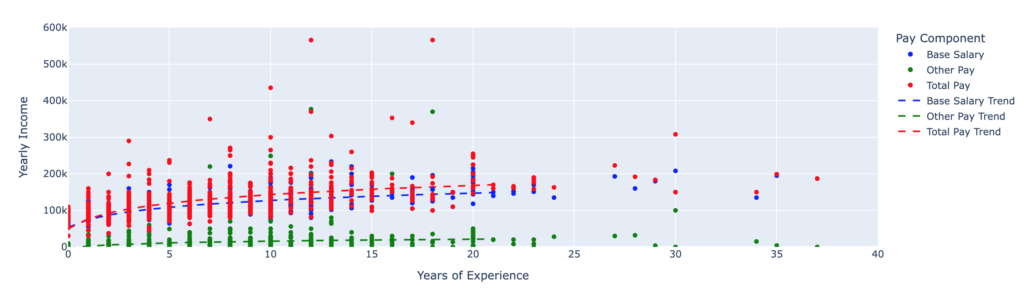
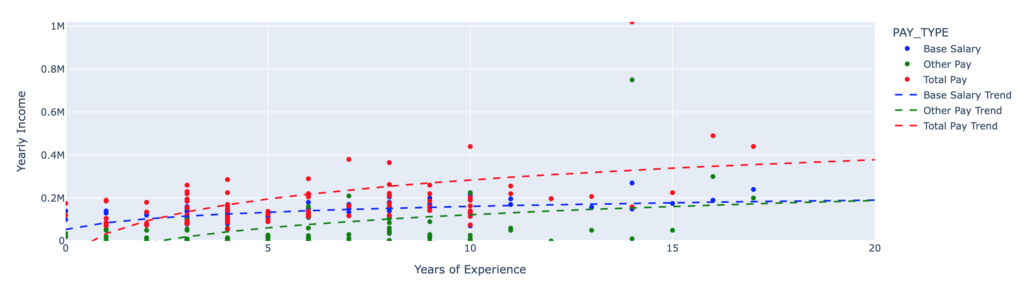
Pay Components
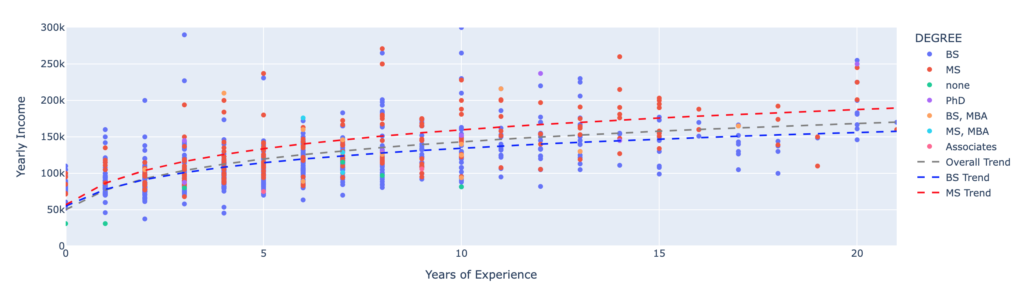
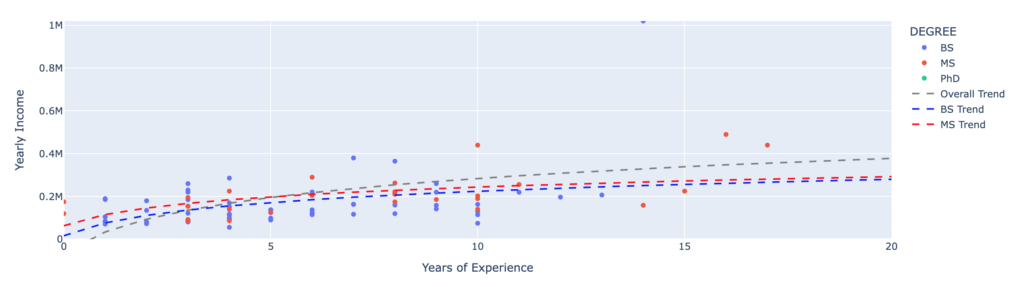
Degree Comparison
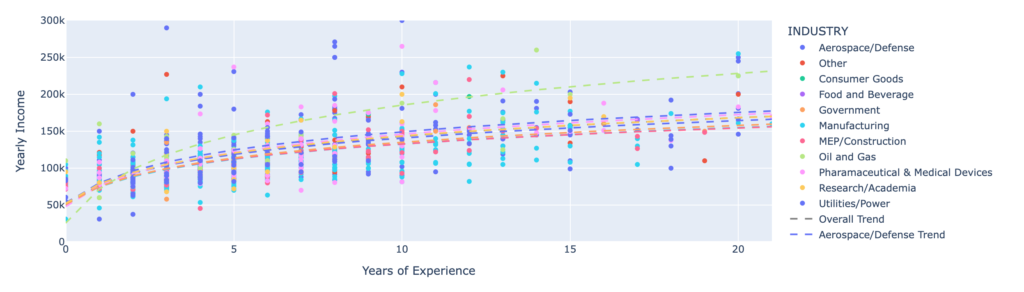
Industry Comparison
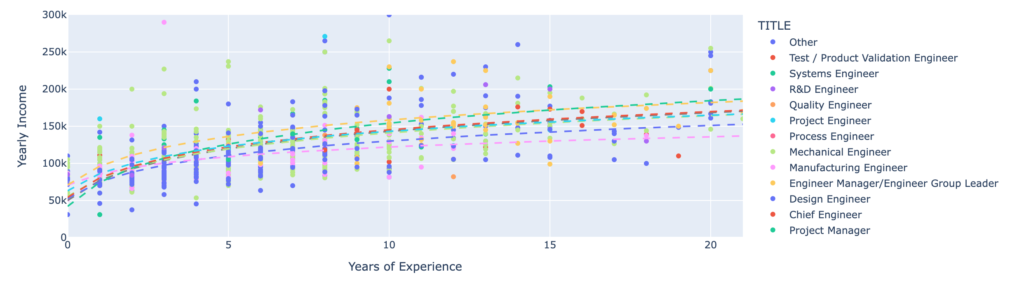
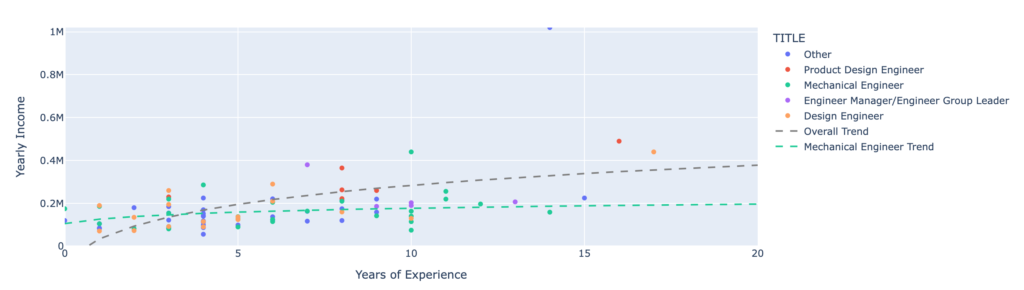
Title Comparison
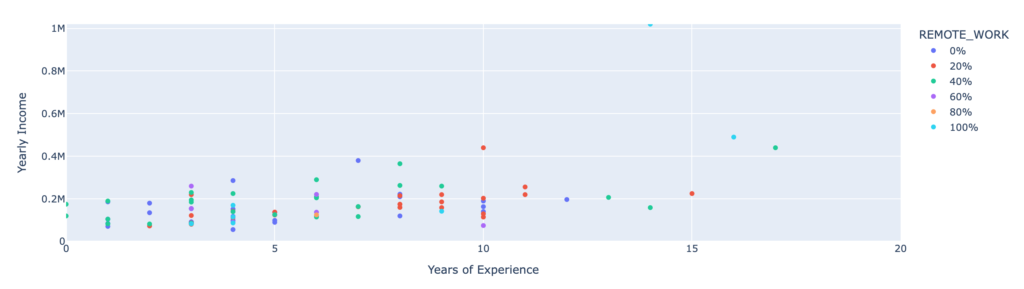
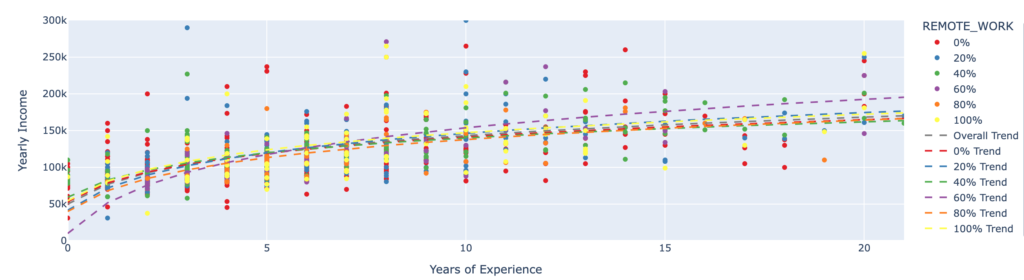
Remote Work Comparison
Pay Components
Degree Comparison
Title Comparison
Remote Work Comparison